Labop Datasets
19 Mar 2023 - Daniel Bryce (danbryce.bioprotocols@gmail.com)
The Bioprotocols Working Group is pleased to announce a new LabOP feature for handling dataset specifications within prototcols.
This new feature benefits LabOP users, as follows:
- Prescribe experimental data to collect, and incorporate data values after collection,
- Link experimental data and metadata to reproducibly consolidate a dataset specification, and
- Support dataset development through programmatic interfaces to devices or manual data entry.
Terminology
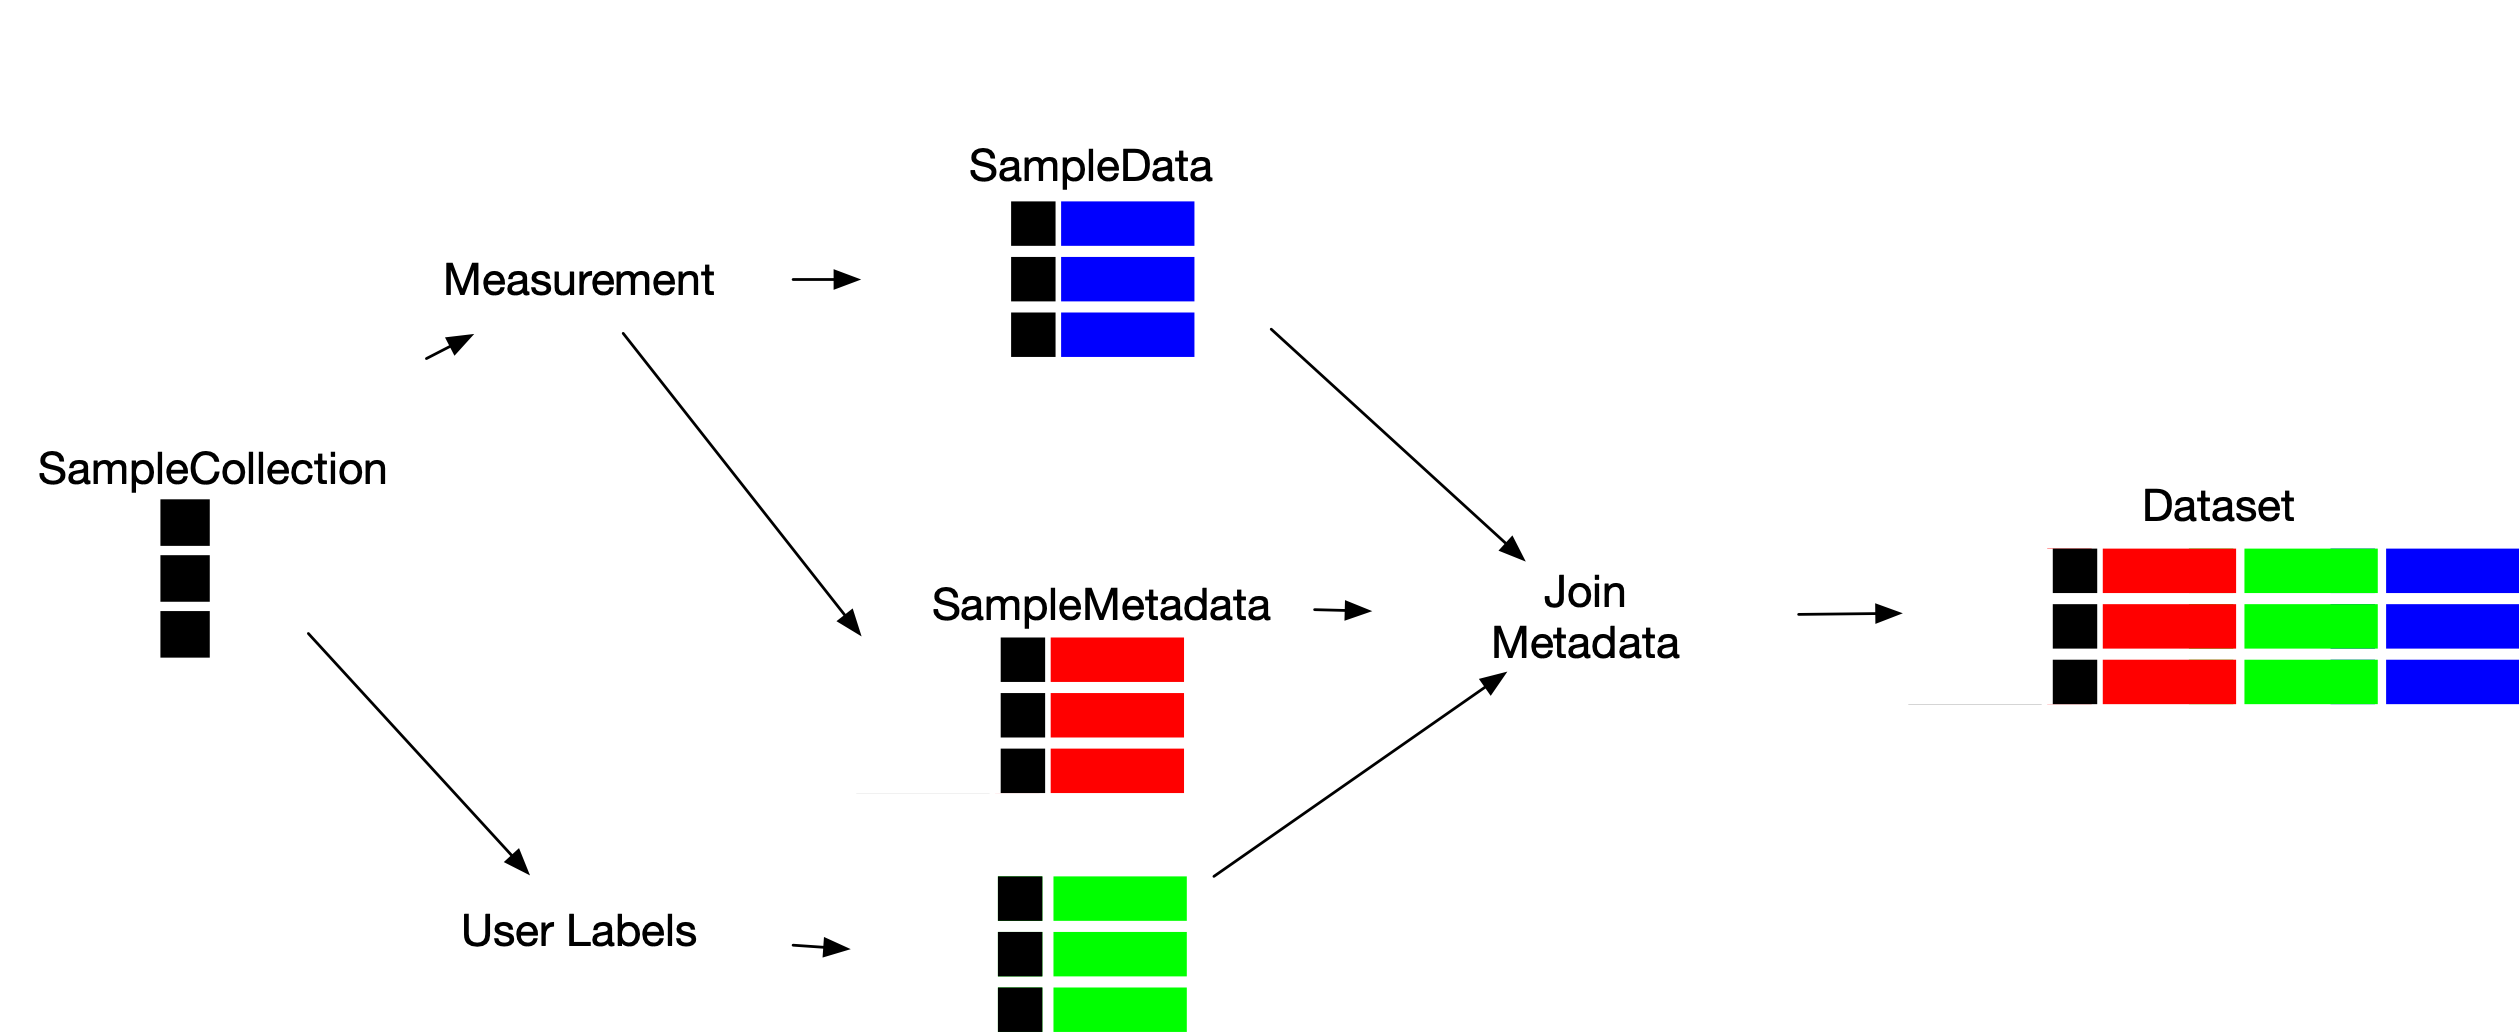
LabOP Datasets represent the data and metadata for sample measurements. LabOP protocols prepare datasets by linking several data types, as follows:
SampleCollection: representing a collection of samples, with two subtypes:SampleArray: representing an array of sample identifiersSampleMask: representing a subset of samples from aSampleCollection
SampleData: representing data for each sample in a referencedSampleCollectionSampleMetadata: representing metadata for each sample in a referencedSampleCollectionDataset: representing a collection ofSampleData,SampleMetadata, andDatasetobjects
A Dataset thus consolidates data and metadata for samples. A LabOP protocol describes how to construct a Dataset through multiple primitives, as follows:
- Sample Creation: several primitives (e.g., EmptyContainer, PlateCoordinates, etc.) output a
SampleCollectionthat describes several samples. - Metadata Generation: primitives (e.g., ExcelMetadata) either output
Metadatadirectly, or indirectly (e.g., MeasureAbsorbance) as part of aDatasetoutput. - Sample Data Generation: primitives (e.g., MeasureAbsorbance) also indirectly generate
SampleData(referencing aSampleCollection) as part of generating theirDatasetoutput - Dataset Generation: as noted above, measurement primitives (e.g., MeasureAbsorbance) generate
Datasetoutput - Dataset Consolidation: the JoinMetadata primitive creates a
Datasetfrom aSampleMetadataandDataset, and the JoinDataset primitive creates aDatasetfrom one or moreDatasetand an optionalSampleMetadata.
LabOP Protocol Dataset Specification Example
The following example illustrates how a protocol can construct a Dataset that includes multiple SampleMetadata. The protocol involves measuring the absorbance of a subset of samples, and developing metadata that describes both the sample contents and measurement instrument parameters.
The figure below illustrates the complete protocol. In the figure, we illustrate each primitive by three layers of rectangles, where rectangles in the top row are input ports, rectangles on the bottom row are output ports, and the center rectangle is the primitive name. The blue edges denote control flow ordering, and black edges denote data flow. The rectangle with a double border is an output parameter. The black circle is the initial node, and the thin black rectangle is a fork node (indicating data flow from a single source to multiple targets).
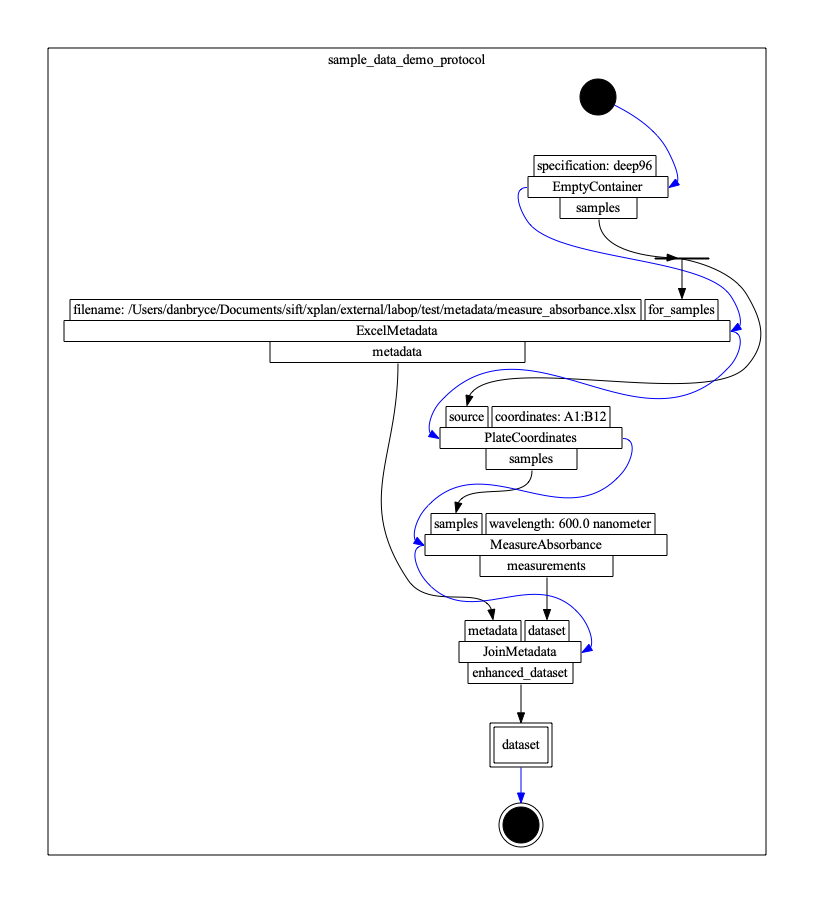
The protocol involves creating a SampleArray, indicating a subset of samples to measure, measuring the samples, reading predefined SampleMetadata, and joining metadata to create a Dataset. We detail the protocol definition using the LabOP python library below.
-
Initialize Protocol:
The following code block initializes an empty
Protocolandsbol3.Document.Import os from tyto import OM import sbol3 import labop from labop.utils.helpers import initialize_protocol protocol, doc = initialize_protocol() -
Sample Creation:
Creating a
SampleCollectionstarts with theEmptyContainerprimitive, and aContainerSpec.# Define the type of container container_type = container_type = labop.ContainerSpec('deep96') # Create an activity to create the container. create_source = protocol.primitive_step( 'EmptyContainer’, specification=container_type )The
samplesoutput pin for thecreate_sourceobject (of typeCallBehaviorExecution) is aSampleArrayobject whosesamplesattribute will (at runtime) be assigned a serialized xarray DataArray object of the form:<xarray.DataArray 'https://bioprotocols.org/demo/test_execution/ActivityEdgeFlow3/LiteralIdentified1/SampleArray1' ( sample: 96)> array(['A1', 'B1', 'C1', 'D1', 'E1', 'F1', 'G1', 'H1', 'A2', 'B2', 'C2', 'D2', 'E2', 'F2', 'G2', 'H2', 'A3', 'B3', 'C3', 'D3', 'E3', 'F3', 'G3', 'H3', 'A4', 'B4', 'C4', 'D4', 'E4', 'F4', 'G4', 'H4', 'A5', 'B5', 'C5', 'D5', 'E5', 'F5', 'G5', 'H5', 'A6', 'B6', 'C6', 'D6', 'E6', 'F6', 'G6', 'H6', 'A7', 'B7', 'C7', 'D7', 'E7', 'F7', 'G7', 'H7', 'A8', 'B8', 'C8', 'D8', 'E8', 'F8', 'G8', 'H8', 'A9', 'B9', 'C9', 'D9', 'E9', 'F9', 'G9', 'H9', 'A10', 'B10', 'C10', 'D10', 'E10', 'F10', 'G10', 'H10', 'A11', 'B11', 'C11', 'D11', 'E11', 'F11', 'G11', 'H11', 'A12', 'B12', 'C12', 'D12', 'E12', 'F12', 'G12', 'H12'], dtype='<U3') Coordinates: * sample (sample) <U3 'A1' 'B1' 'C1' 'D1' 'E1' ... 'E12' 'F12' 'G12' 'H12' -
Sample Metadata Generation:
The
ExcelMetadataprimitive creates aSampleMetadataobject from the contents of an xlsx file with a workbook depicted in the following image: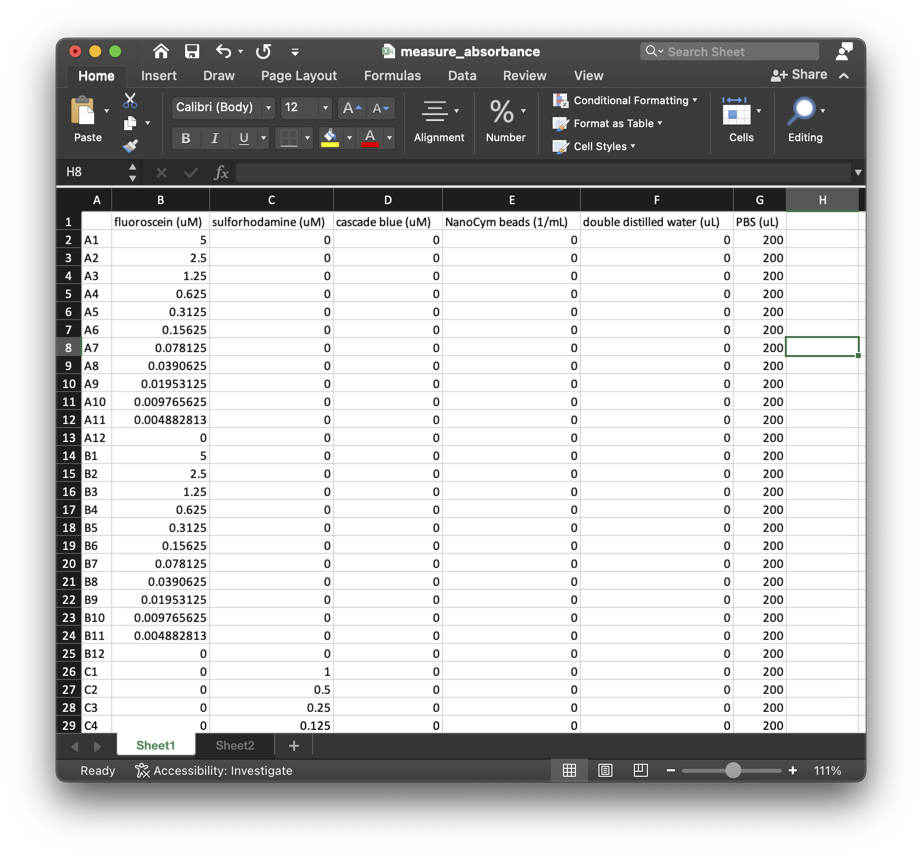
The
SampleArraycreated by theEmptyContainerprimitive includes references to samples that appear in the xlsx file.filename = os.path.join(os.getcwd(), "test", "metadata", "measure_absorbance.xslx”) load_excel = protocol.primitive_step( 'ExcelMetadata', for_samples=create_source.output_pin('samples'), filename=filename )The
SampleMetadataobject created by executing theExcelMetadataprimitive has a serialized xarray Dataset of the form:<xarray.Dataset> Dimensions: (sample: 96) Coordinates: * sample (sample) <U3 'A1' 'A2' 'A3' ... 'H11' 'H12' Data variables: fluorescein (uM) (sample) float64 5.0 2.5 1.25 ... 0.0 0.0 0.0 sulforhodamine (uM) (sample) float64 0.0 0.0 0.0 ... 0.0 0.0 0.0 cascade blue (uM) (sample) float64 0.0 0.0 0.0 ... 0.0 0.0 0.0 NanoCym beads (1/mL) (sample) float64 0.0 0.0 ... 7.324e+05 double distilled water (uL) (sample) int64 0 0 0 0 0 ... 200 200 200 200 PBS (uL) (sample) int64 200 200 200 200 200 ... 0 0 0 0The final
Datasetdefines the value of several metadata attributes (variables) for each sample, originally appearing as columns in the xlsx file. -
Measurement Data and Metadata Generation:
The
MeasureAbsorbanceprimitive reports aDatasetwithSampleMetadataandSampleDatafor theSampleCollectiondefined by itssamplesattribute. In this example, theSampleCollectionis aSampleMaskthat identifies a subset of the samples as an xarray DataArray:create_coordinates = protocol.primitive_step( 'PlateCoordinates', source=create_source.output_pin('samples'), coordinates="A1:B12” )The
samplesoutput pin represents the mask as an xarray DataArray of the form:<xarray.DataArray 'https://bioprotocols.org/demo/test_execution/ActivityEdgeFlow8/LiteralIdentified1/SampleMask1' ( sample: 24)> array(['A1', 'B1', 'A2', 'B2', 'A3', 'B3', 'A4', 'B4', 'A5', 'B5', 'A6', 'B6', 'A7', 'B7', 'A8', 'B8', 'A9', 'B9', 'A10', 'B10', 'A11', 'B11', 'A12', 'B12'], dtype='<U3') Coordinates: * sample (sample) <U3 'A1' 'B1' 'A2' 'B2' 'A3' ... 'A11' 'B11' 'A12' ‘B12'Executing
MeasureAbsorbanceproduces aDatasetthat relates aSampleMetadataand aSampleDataobject.measure_absorbance = protocol.primitive_step( 'MeasureAbsorbance', samples=create_coordinates.output_pin('samples'), wavelength=sbol3.Measure(600, OM.nanometer) )The
SampleDataholds the data for each sample with an xarray DataArray of the form:<xarray.DataArray (sample: 24)> array([nan, nan, nan, nan, nan, nan, nan, nan, nan, nan, nan, nan, nan, nan, nan, nan, nan, nan, nan, nan, nan, nan, nan, nan]) Coordinates: * sample (sample) <U3 'A1' 'A2' 'A3' 'A4' 'A5' ... 'B9' 'B10' 'B11' 'B12'The generated
SampleMetadataincludes information about theMeasureAbsorbanceinputs (i.e., wavelength), as follows:<xarray.Dataset> Dimensions: (sample: 24) Coordinates: * sample (sample) <U3 'A1' 'A2' 'A3' 'A4' 'A5' ... 'B9' 'B10' 'B11' 'B12' Data variables: wavelength (sample) <U102 'https://bioprotocols.org/demo/demo_protocool/...The wavelength variable refers to a LabOP object that defines the wavelength as an ontologies of measure object that can be exported in a human readable format as “600 nanometer”.
-
Dataset Generation:
The
Dataset.to_dataset()function can merge the xarray representations of theSampleMetadataandSampleData(i.e., join along the sample coordinates) to produce an xarray Dataset of the form:<xarray.Dataset> Dimensions: ( sample: 24) Coordinates: * sample (sample) <U3 ... Data variables: https://bioprotocols.org/demo/test_execution/ActivityEdgeFlow12/LiteralIdentified1/Dataset1/SampleData1 (sample) float64 ... wavelength (sample) <U102 ...where
https://bioprotocols.org/demo/test_execution/ActivityEdgeFlow12/LiteralIdentified1/Dataset1/SampleData1is data for each sample, and thewavelengthis metadata for each sample. This intermediateDatasetrelates the measurementSampleMetadatato theSampleData. In the following, we elaborate thisDatasetwith additional metadata.-
Dataset Consolidation:
Finally, the
JoinMetadataprimitive can relate additionalSampleMetadatatoDatasetobjects. In the following, theJoinMetadataprimitive adds the sample metadata extracted from the xlsx file to the Dataset produced by theMeasureAbsorbanceprimitive:meta1 = protocol.primitive_step( "JoinMetadata", dataset=measure_absorbance.output_pin('measurements'), metadata=load_excel.output_pin('metadata’) )The protocol returns a
datasetparameter that reports theenhanced_metadataproduced byJoinMetadata(including both sample descriptions and instrument settings, as well as the measurement data):protocol.designate_output( 'dataset', 'http://bioprotocols.org/labop#Dataset', source=meta1.output_pin('enhanced_dataset') )The
Dataset.to_dataset()function produces a consolidated xarray Dataset of the form:<xarray.Dataset> Dimensions: ( sample: 96) Coordinates: * sample (sample) <U3 ... Data variables: https://bioprotocols.org/demo/[...]/SampleData1 (sample) float64 ... wavelength (sample) object ... fluorescein (uM) (sample) float64 ... sulforhodamine (uM) (sample) float64 ... cascade blue (uM) (sample) float64 ... NanoCym beads (1/mL) (sample) float64 ... double distilled water (uL) (sample) int64 ... PBS (uL) (sample) int64 ...The xarray Dataset can be converted to a number of formats, including a pandas Dataframe:
        https://bioprotocols.org/demo/[...]/Dataset1/SampleData1                                         wavelength  fluorescein (uM)  ...  NanoCym beads (1/mL)  double distilled water (uL)  PBS (uL)
sample                                                                                                                                                                                ...
A1                                               0.994238                                                        https://bioprotocols.org/demo/...          5.000000  ...                   0.0                            0       200
A10                                              0.690957                                                        https://bioprotocols.org/demo/...          0.009766  ...                   0.0                            0       200
A11                                              0.379377                                                        https://bioprotocols.org/demo/...          0.004883  ...                   0.0                            0       200
A12                                              0.006668                                                        https://bioprotocols.org/demo/...          0.000000  ...                   0.0                            0       200
A2                                               0.076588                                                        https://bioprotocols.org/demo/...          2.500000  ...                   0.0                            0       200
...                                                   ...                                                                                                      ...               ...  ...                   ...                          ...       ...
H5                                                    NaN                                                                                                      NaN          0.000000  ...            93750000.0                          200         0
H6                                                    NaN                                                                                                      NaN          0.000000  ...            46875000.0                          200         0
H7                                                    NaN                                                                                                      NaN          0.000000  ...            23437500.0                          200         0
H8                                                    NaN                                                                                                      NaN          0.000000  ...            11718750.0                          200         0
H9                                                    NaN                                                                                                      NaN          0.000000  ...             5859375.0                          200         0

[96 rows x 8 columns]
or a more human readable format with
Dataset.humanize():<xarray.Dataset> Dimensions: (sample: 96) Coordinates: * sample (sample) <U3 'A1' 'A10' ... 'H8' 'H9' Data variables: MeasureAbsorbance.measurements.76 (sample) float64 nan nan nan ... nan nan wavelength (sample) <U15 '600.0 nanometer' ... 'nan' fluorescein (uM) (sample) float64 5.0 0.009766 ... 0.0 0.0 sulforhodamine (uM) (sample) float64 0.0 0.0 0.0 ... 0.0 0.0 cascade blue (uM) (sample) float64 0.0 0.0 0.0 ... 0.0 0.0 NanoCym beads (1/mL) (sample) float64 0.0 0.0 ... 5.859e+06 double distilled water (uL) (sample) int64 0 0 0 0 ... 200 200 200 PBS (uL) (sample) int64 200 200 200 200 ... 0 0 0The execution engine also constructs an xlsx file that includes all
SampleDataandDatasetobjects. The following figures illustrate two respective sheets of the xlsx workbook corresponding to theSampleDataand theDataset.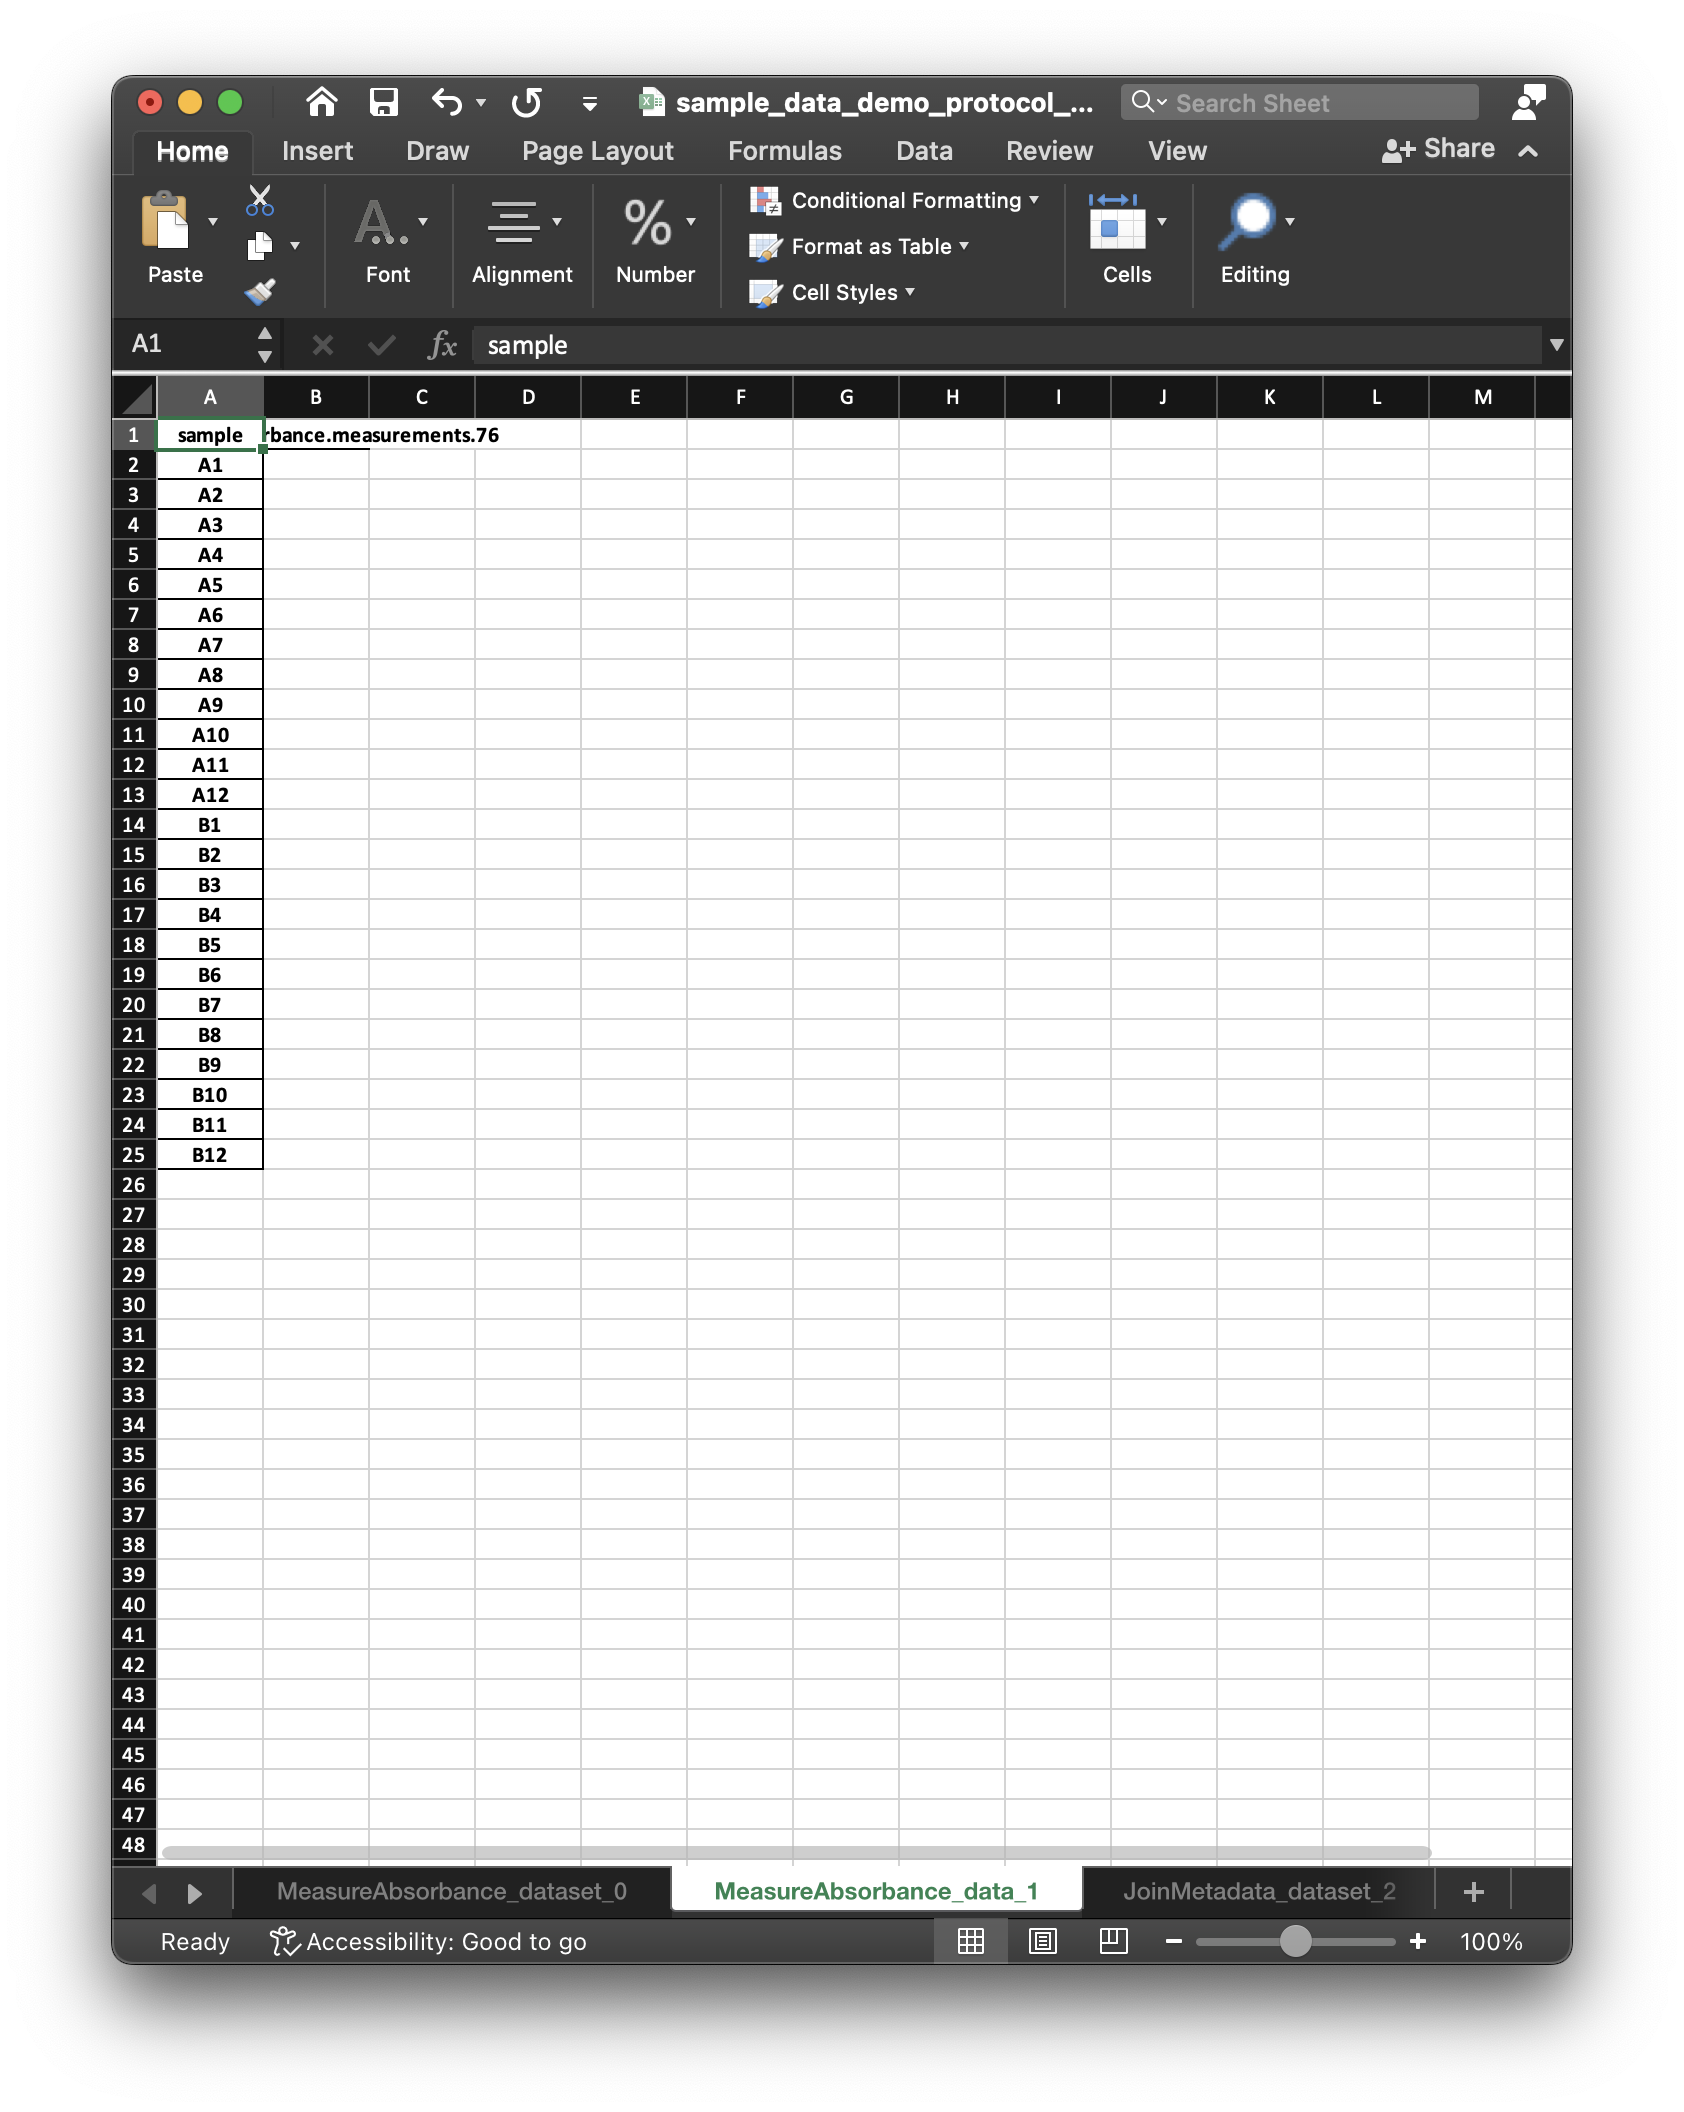
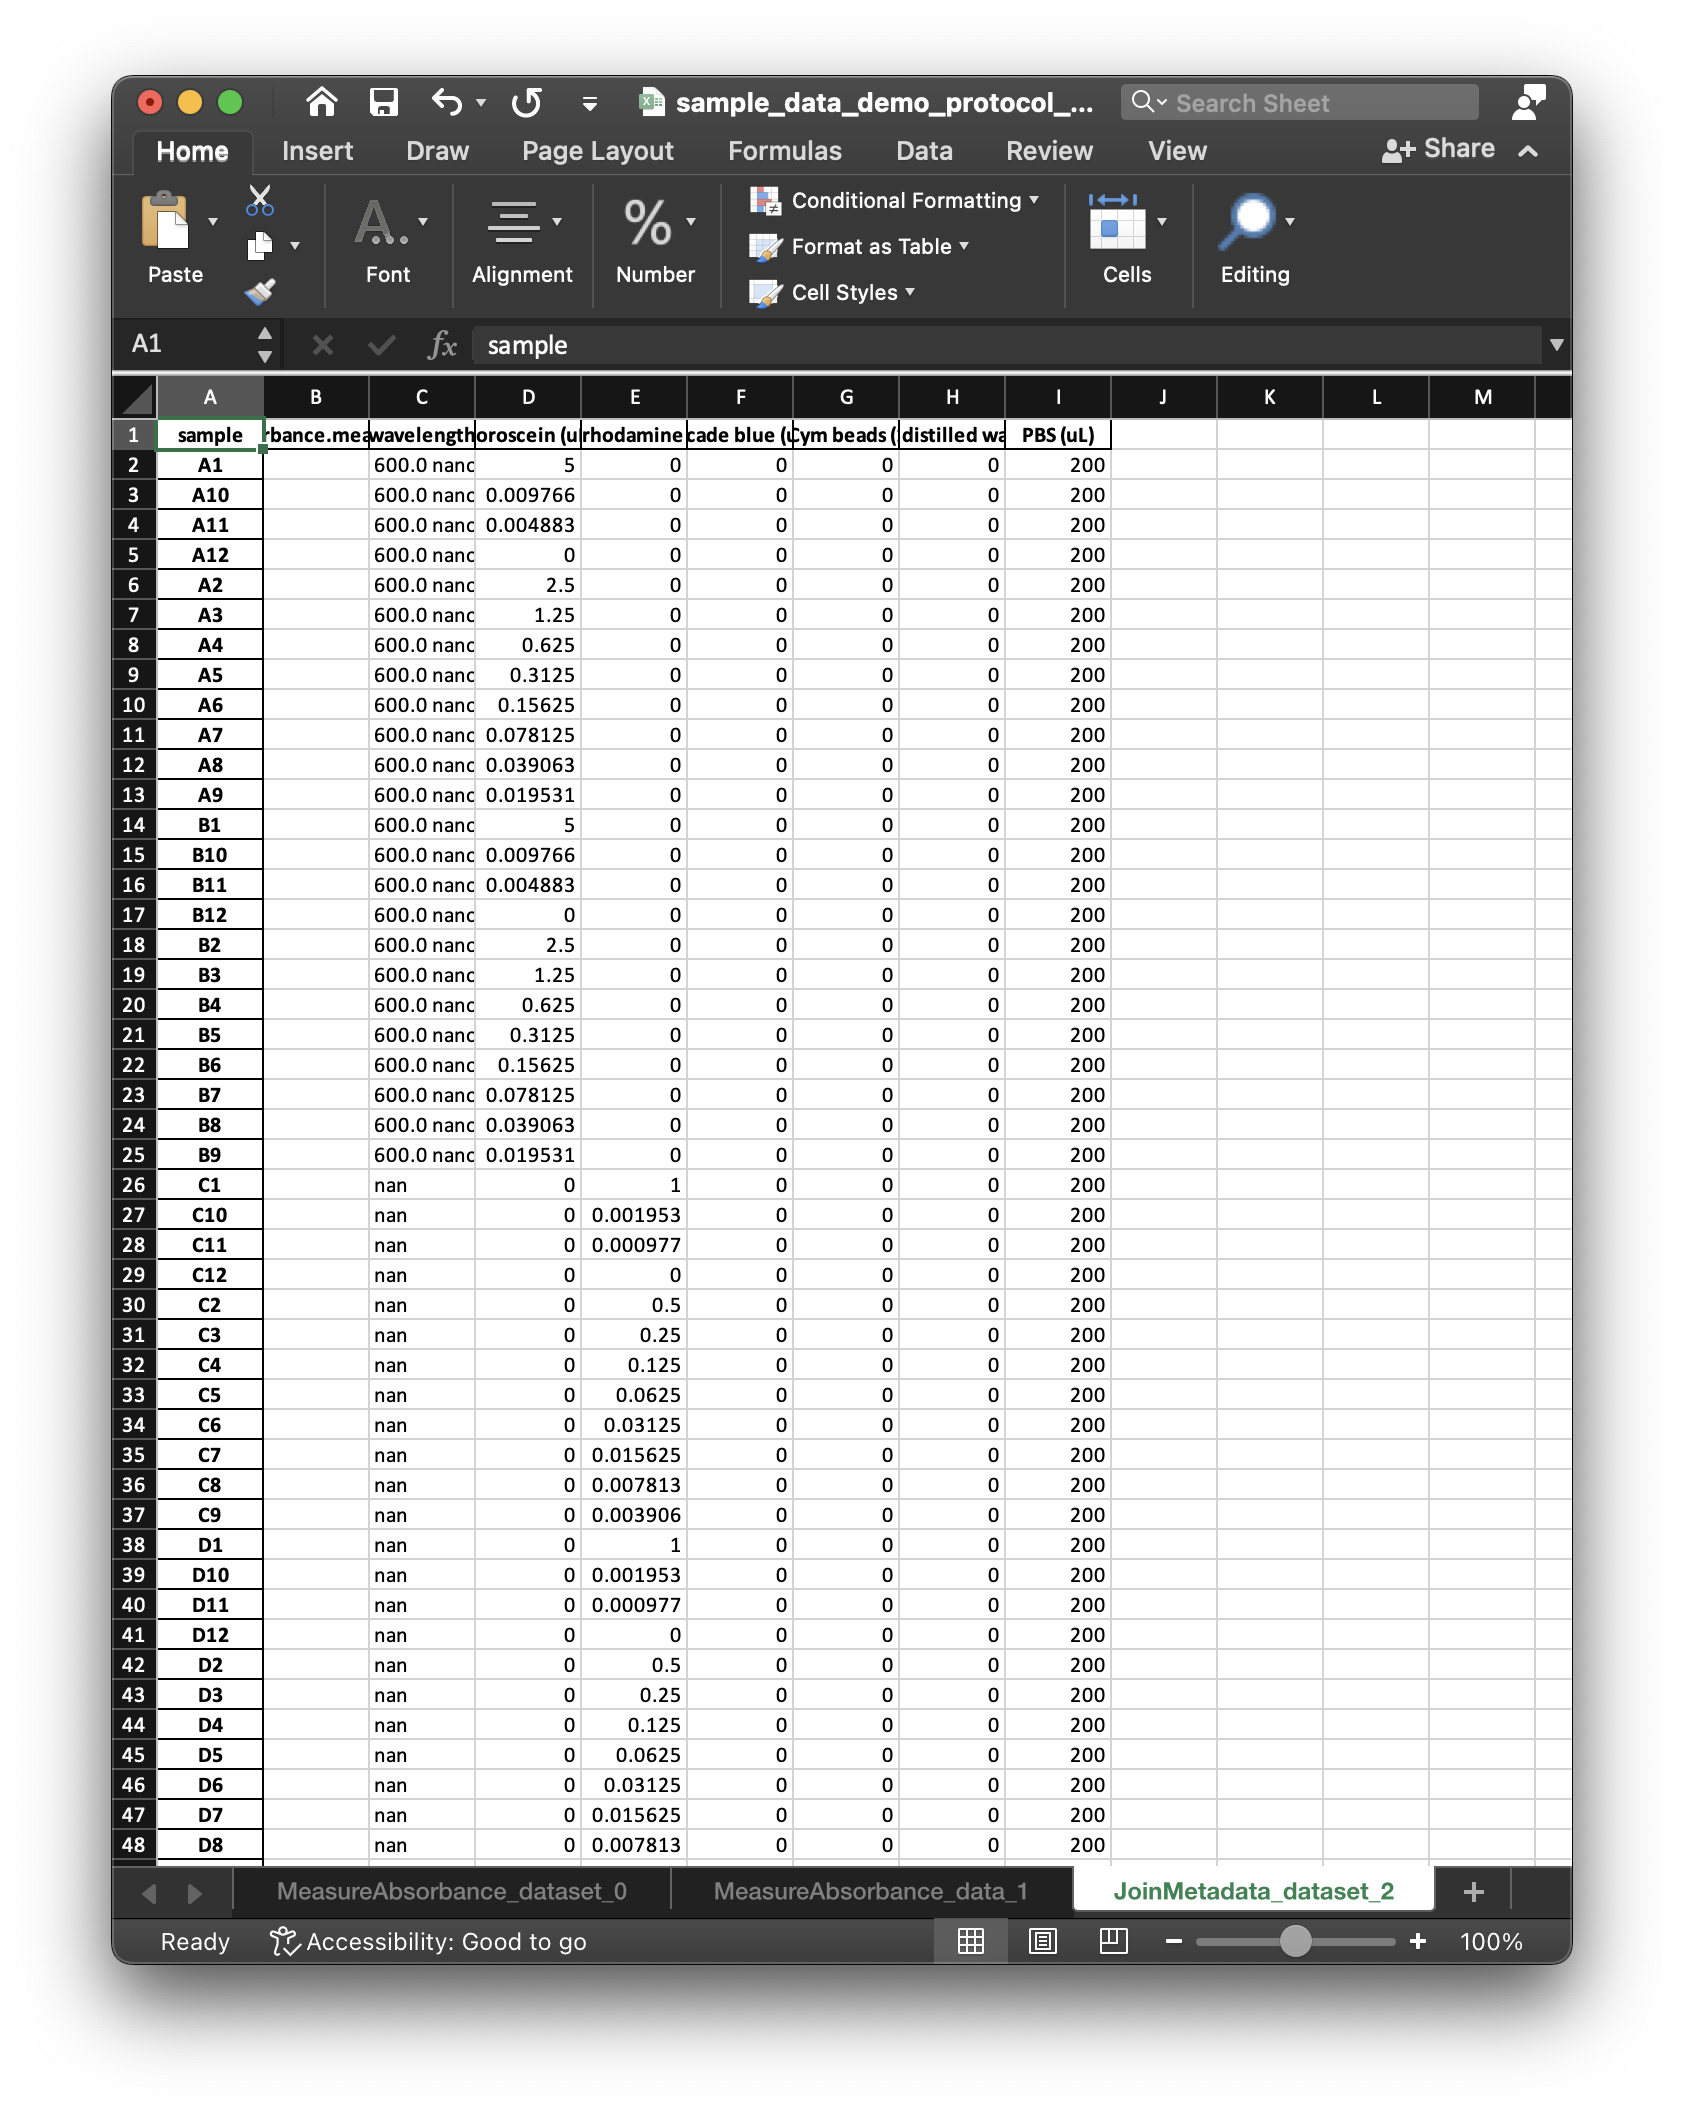
The
SampleDataandDatasetworksheets include an empty column for the data to be collected, and (along with the protocol) correspond to what we mean by a “dataset specification”. After entering data values in theSampleDataworksheet, LabOP can read the workbook to populate theDatasetwith the entered values.
-
Multicolor Calibration Protocol
As a full example, the multicolor calibration protocol uses similar dataset specification primitives to describe the Dataset comprising three types of fluorescence measurements and one type of absorbance measurement. LabOP creates several artifacts for the protocol, including:
- Markdown Document (md): the markdown representation of the protocol is a human readable document generated from the LabOP protocol by the LabOP library.
- Markdown Document (pdf): the pdf rendering of the markdown document includes additional linked figures.
- Dataset Workbook (xlsx): The Dataset workbook is generated by the LabOP library to describe the
SampleDatatemplates and theDatasetspecification. - Protocol Script: the python script will generate all protocol artifacts by using the LabOP library and execution engine to instantiate and perform “pre-flight” execution of the protocol.
- Protocol Visualization (pdf): The graphviz rendering of the protocol illustrates the activities required to execute the protocol in a UML-like format.
- Protocol Input Metadata: the input metadata describes the contents of the samples measured by the protocol, and is used to construct the
Dataset. - Protocol and Protocol Execution Trace RDF (nt): the RDF representation of the protocol and execution trace is the LabOP representation of the protocol that is used as the common protocol representation.